What Worker Fatigue Monitoring Data Actually Tells You
An explainer for EHS directors on how to interpret vital signs and fatigue monitoring data to mitigate risk in safety-critical industrial operations.
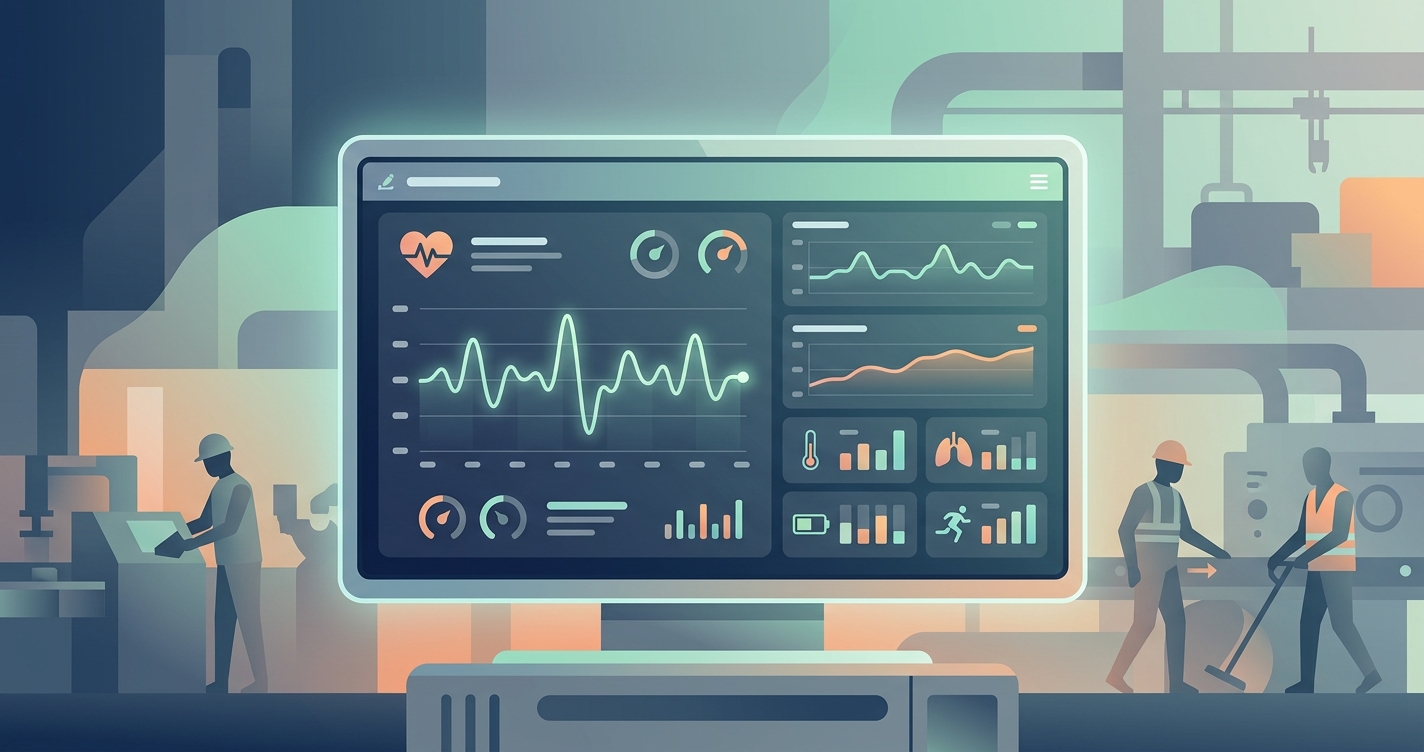
For modern Environmental, Health, and Safety (EHS) directors, preventing industrial accidents requires looking beyond shift schedules and self-reported readiness. The focus has shifted from lagging indicators, such as injury reports, to leading indicators grounded in physiological reality. When operations transition to proactive risk mitigation, analyzing worker fatigue monitoring data becomes a standard operational protocol. Instead of waiting for a near miss or a dropped load, safety managers can now interpret subtle physiological trends that precede exhaustion. This shift allows occupational health teams to intervene hours before a worker's cognitive or physical capacity degrades to a dangerous level.
"Approximately 13 percent of all workplace injuries are directly attributed to fatigue, and an organization with 1,000 employees can incur over 1 million dollars annually due to fatigue-related safety incidents and productivity losses." , National Safety Council, Fatigue Research Report, 2023
Decoding worker fatigue monitoring data
When occupational health providers look at worker fatigue monitoring data, they are not looking for a single threshold of exhaustion. Instead, they are analyzing the autonomic nervous system. The autonomic nervous system controls involuntary physiological processes, including heart rate, blood pressure, and respiration. It is divided into two primary branches. The sympathetic nervous system drives the fight-or-flight response, mobilizing energy during times of physical or mental stress. The parasympathetic nervous system manages the rest-and-digest recovery processes, slowing the heart and facilitating cellular repair.
In a fully rested worker, these two systems maintain a dynamic balance. This balance is measurable through heart rate variability. Heart rate variability is the fluctuation in the time intervals between adjacent heartbeats. High heart rate variability indicates a flexible, responsive autonomic nervous system capable of adapting to operational stress. Low heart rate variability indicates that the body is under physiological strain, often dominated by sympathetic activity, and is struggling to recover.
Specific metrics within heart rate variability data provide deep insights into worker readiness. For example, the Root Mean Square of Successive Differences is a time-domain measurement that specifically quantifies parasympathetic activity. When this metric drops significantly below a worker's established baseline, it strongly suggests insufficient sleep or inadequate recovery from a previous shift. By tracking these vital signs fatigue indicators over time, safety managers can observe the gradual decline of autonomic flexibility. This decline is the earliest warning sign of systemic fatigue, allowing for targeted intervention long before severe cognitive impairment occurs.
| Metric Category | Data Source | Objective Reliability | Actionability for EHS |
|---|---|---|---|
| Subjective Surveys | Worker self-reporting | Low (prone to bias) | Reactive (post-incident) |
| Performance Tests | Cognitive reaction tasks | Moderate (learning curve effects) | Point-in-time only |
| Physiological Data | Vitals screening tools | High (autonomic indicators) | Proactive (pre-incident) |
| Lagging Indicators | Accident and error logs | Absolute (historical record) | Zero (damage already done) |
To effectively utilize physiological data, EHS teams track a combination of specific fatigue risk metrics. These continuous measurements form the foundation of a proactive safety program:
- Heart rate variability time-domain indices
- Resting heart rate baseline deviations
- Respiratory rate changes under resting conditions
- Autonomic nervous system recovery rates between shifts
- Core temperature variations connected to circadian rhythm disruption
Industry applications for safety dashboard insights
Translating raw physiological data into actionable safety dashboard insights is transforming how high-risk industries manage their workforces. The application of this data varies depending on the specific environmental stressors of the industry.
Heavy construction and mining
In heavy construction and mining, operators manage massive equipment like haul trucks, cranes, and excavators. The repetitive nature of the work, combined with long hours, high vibration, and environmental stressors, creates a high-risk environment for micro-sleeps. Safety dashboard insights allow site managers to see when a specific crew is trending toward hazardous fatigue levels. If a haul truck operator shows a sharp decline in autonomic recovery metrics during a pre-shift screening, the supervisor can reassign that individual to a lower-risk task on the ground before they ever climb into the cab.
Manufacturing and logistics
Manufacturing facilities and logistics hubs operate on tight margins and strict 24-hour schedules. Shift work is mandatory, and the transition between day shifts and night shifts is notoriously disruptive to human circadian rhythms. Fatigue trend analysis helps EHS directors identify systemic scheduling issues across the entire facility. If a specific shift rotation consistently produces poor physiological recovery data across multiple workers, the occupational health team can restructure the schedule to optimize rest periods. This systemic approach reduces the overall risk profile of the facility without singling out individual employees.
Energy and offshore operations
Offshore oil rigs and remote renewable energy sites require workers to live in isolated environments for weeks at a time. The cumulative stress of isolation, extended shifts, and high-stakes operations accelerates physical exhaustion. In these environments, worker fatigue monitoring data serves as a critical daily health check. Because advanced medical intervention is often hours or days away, identifying fatigue-related cardiovascular stress early is necessary for preventing both industrial accidents and sudden medical emergencies on site.
Current research and evidence
The scientific consensus on occupational fatigue has solidified around the necessity of objective physiological measurement. Recent clinical studies have demonstrated the direct link between shift work, autonomic nervous system disruption, and negative safety outcomes.
In 2023, researcher Gerben Hulsegge and his colleagues at the Amsterdam Public Health Research Institute published findings on the impact of shift work on heart rate variability. Their research on blue-collar shift workers established that the physiological stress of night shifts leads to significantly reduced heart rate variability. The data showed that the cardiovascular system struggles to recover during disrupted sleep cycles, leaving workers in a prolonged state of sympathetic dominance. This lack of recovery directly impairs cognitive function, decision-making, and physical reaction times on the floor.
Similarly, James B. Burch and his research team at the University of South Carolina conducted a 2023 study focusing on heart rate variability coherence in shift workers. By analyzing the physiological data of nurses working demanding night shifts, Burch demonstrated that autonomic nervous system dysregulation correlates directly with increased error rates and decreased situational awareness. The study confirmed that vital signs are highly predictive of a worker's capacity to perform safety-critical tasks accurately.
The National Safety Council further quantifies this operational risk. Their industrial safety reports indicate that 97 percent of workers have at least one workplace fatigue risk factor, and over 43 percent of the industrial workforce is chronically sleep-deprived. The integration of objective fatigue risk metrics into daily operations provides the only scalable, scientifically validated defense against this pervasive hazard.
The future of worker fatigue monitoring data
The next phase of occupational health screening will focus heavily on predictive analytics and longitudinal health tracking. Currently, most EHS programs rely on point-in-time assessments to determine if a worker is fit for a specific shift. In the near future, continuous baselining will allow safety systems to forecast fatigue risks days before they manifest as physical operational hazards.
As data collection methods become more refined, fatigue trend analysis will integrate with broader environmental datasets. Safety teams will be able to cross-reference physiological recovery rates with ambient site temperature, shift duration, specific physical task loads, and historical accident data. This holistic approach will enable dynamic risk modeling. Instead of applying blanket safety protocols to an entire workforce, organizations will tailor fatigue countermeasures to the specific physiological needs and recovery rates of individual workers. By transitioning from reactive compliance protocols to predictive prevention models, industrial sites will significantly reduce the frequency of catastrophic incidents.
Frequently asked questions
What are the most reliable vital signs fatigue indicators?
Heart rate variability and resting heart rate are currently the most reliable physiological indicators of fatigue. These metrics measure the autonomic nervous system, providing an objective assessment of how well a worker has physically recovered from previous physical exertion and cognitive stress.
How much data is required to establish a baseline for fatigue risk metrics?
A reliable baseline typically requires several consecutive days of pre-shift physiological screening. Once the system establishes a worker's normal physiological range, it can accurately detect deviations that indicate acute sleep deprivation or chronic systemic fatigue.
Does fatigue trend analysis replace traditional fitness-for-duty testing?
It does not entirely replace traditional testing, but it drastically improves the initial screening process. Physiological data acts as an immediate, objective filter. If the data flags a high risk of fatigue, EHS directors can then mandate targeted cognitive or physical assessments before clearing the worker for a high-risk shift.
How do safety teams act on safety dashboard insights without causing operational delays?
Modern screening technologies operate in seconds, allowing for rapid throughput at security gates or locker rooms. When a safety dashboard flags an anomaly, only that specific worker is pulled aside for secondary review. This targeted approach prevents fleet-wide operational bottlenecks while maintaining strict safety standards.
Managing occupational fatigue requires moving beyond subjective questionnaires and embracing objective physiological metrics. For EHS directors ready to transition from reactive incident management to proactive risk mitigation, Circadify is addressing this space with advanced screening architectures. By integrating precise vital signs tracking into your daily operations, you can identify hidden vulnerabilities before they compromise site safety. Learn how to implement these systems by exploring our reporting walkthrough at https://circadify.com/solutions/fraud-detection.